You don’t have to be a web developer

Before you run away thinking this article topic is too advanced, I’d like to point out that even if you don’t understand what we’ll be looking at, providing the information we’ll uncover to someone else — like a website owner such as myself — can be invaluable.
Modern browsers, including Google Chrome, Firefox, and the new chromium-based version of Microsoft Edge, include an incredibly useful tool for debugging webpage problems. Normally considered a “developers’ tool” (because it’s used primarily by website developers), it’s available to anyone at any time.
Knowing about it, even at a superficial level, can help you diagnose issues you experience online.
And, as I said, even of you don’t “get it”, I’ll show you the kind of information you can pass on to those who do. It makes their life easier and increases the chance that whatever problem you’re experiencing can be resolved.

Inspect is a web page diagnostic tool built into major web browsers. Right-click on a page and click “Inspect” to open a separate pane of detailed information. The most basic use is to see what in the page’s HTML or CSS coding corresponds to specific elements on the page. Use the inspect console to view errors reported by the browser as the page is loaded to identify issues, or provide information to the website developer.
What inspect is
At its most basic, Inspect is a live, side-by-side view of a webpage and the HTML that generated it.
At its most complex, Inspect is a window in which you can perform trial-and-error modifications to webpages to see what the result looks like, as well as tools to analyze performance, determine what files comprise a webpage, where those files come from, the memory they use, security information, and more.
The best way to understand Inspect is to take a look.
In another window, open up https://askleo.com. Then:
- In Google Chrome: right-click on the page and click on Inspect (or just type CTRL+SHIFT+I)
- In Firefox: right-click on the page and click on Inspect Element
- In Edge1: right-click on the page and click on Inspect (or just type CTRL+SHIFT+I)
This will open the Inspect pane, typically on the right.
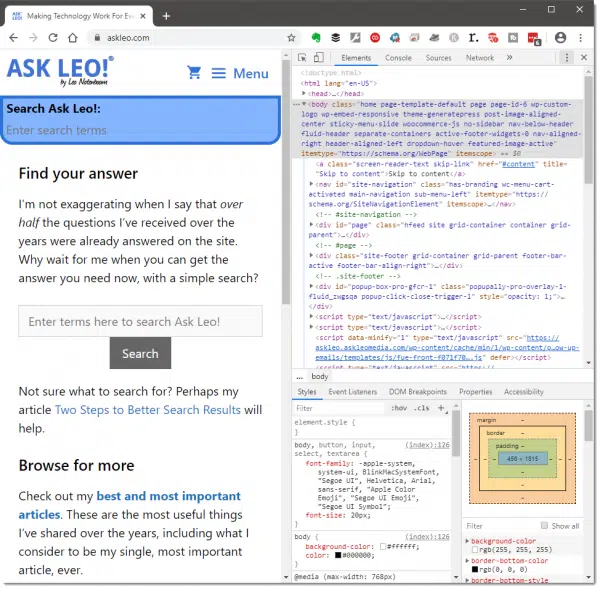
The examples below are all based on Google Chrome, but the other browsers are similar, if not identical.
Moving the inspect pane
In the upper right of the inspection pane is a vertical ellipsis. Click on that to expose additional options.
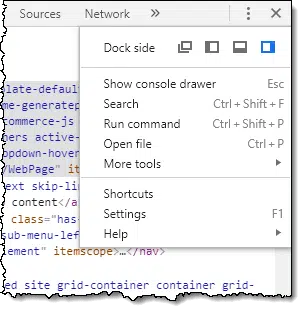
The dock side options are, from left to right:
- Place the Inspect pane in a separate window.
- Place the Inspect pane to the left of the browser content pane.
- Place the Inspect pane underneath the browser content pane.
- Place the Inspect pane to the right of the browser content pane. (The setting displayed in the example above.)
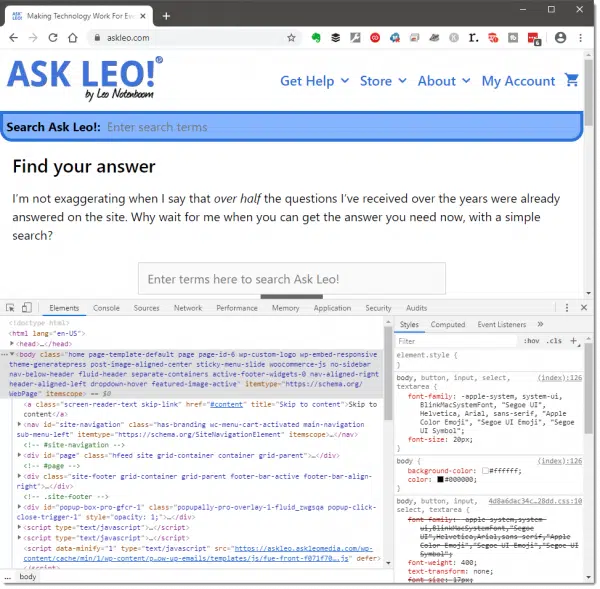
I prefer the Inspect pane below my web page, so as to allow the web page to display full width, so I’ll click on the “underneath” option. This will be remembered so you won’t need to do it again next time.
View page elements to corresponding HTML
With the Inspect pane open as shown above, simply mouse over the various lines or HTML displayed. The corresponding webpage elements they represent will be highlighted as you move.
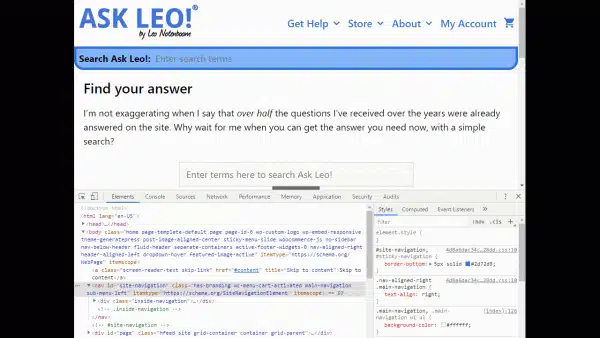
You can also simply click on an HTML element in the Inspect pane to highlight the corresponding element in the webpage.
Click on the right-pointing triangles (
View HTML corresponding to page elements
In the upper left of the Inspect pane, click on the leftmost icon, which contains a small pointer.
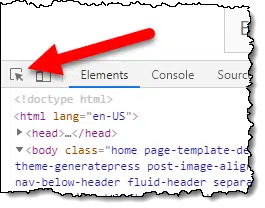
Now move your mouse over the webpage in the upper pane. The corresponding HTML associated with whatever the mouse is pointing at will be highlighted, expanding and scrolling it into view if necessary.
Click on a webpage element to freeze the highlighting on the HTML corresponding to that element.
Regardless of how you get there, once you identify the HTML corresponding to an on-page element, you can see and manipulate the HTML and CSS corresponding to that element and the specifics of how it’s displayed.
Going much deeper than that is beyond the scope of this article, but with even a little understanding of HTML, it’s a great place to experiment, gather data, and understand why things display the way they do.
There’s one more thing I want to make you aware of, however.
The Inspect console, and errors
Visit Broken Image Example on Ask Leo! for exactly that: an example of a webpage with a broken image.
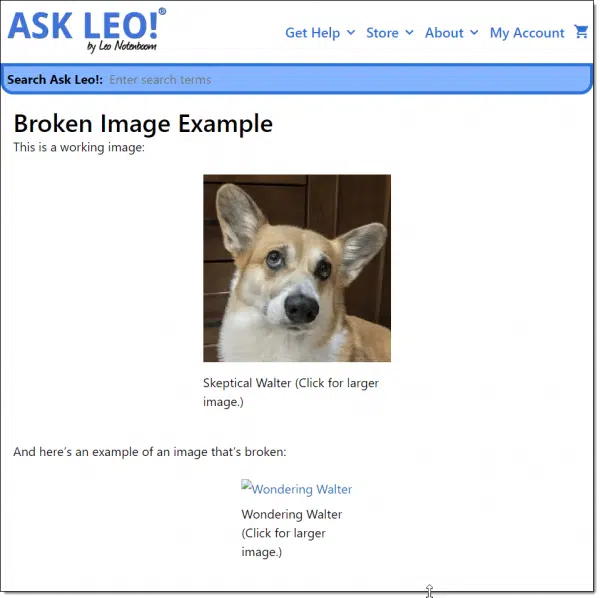
As you can see, there are supposed to be two images, but only one is displaying.
Open the Inspect pane, and on its menu bar, click on Console.
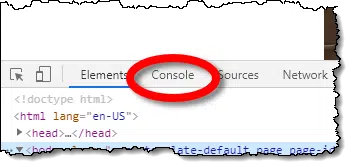
This will open a secondary pane, typically in place of the first, “Elements” pane, with additional information.

Help keep it going by becoming a Patron.
As you can see, in this case an error has been reported relating to the load of that second image.2 For more information, if you hover the mouse over the filename displayed, the full URL to the referenced file will be displayed.
Console information can be valuable
If you’re reporting a webpage error to someone, it’s not uncommon for the information displayed in the console during a page load to be incredibly valuable.
Consider taking a screenshot and including it with your report.
It may not help, but on the other hand, it may provide just the clue the website owner needs.
We’ve just scratched the surface
As the complexity of the Inspect pane shows, it’s an incredibly powerful tool for website developers. I can’t tell you the number of times it’s helped me answer two very specific questions:
- Why is it doing that?
- How do I make it do this?
If you’re at all into webpage creation, I strongly recommend you become more familiar with the tool and its capabilities. Hopefully, I’ve whetted your appetite.
If you’re not a webpage developer, fear not. You can, of course, safely ignore Inspect completely. On the other hand, it might also help you provide more information when reporting a problem.
Related Video
Do this
Subscribe to Confident Computing! Less frustration and more confidence, solutions, answers, and tips in your inbox every week.
I'll see you there!


I tried this in the Opera browser and the menus are identical to the instructions in the article. Is Inspect a third party app which all of the browsers use or could it be part of the original Chromium browser?
It’s part of Chromium, I’m sure. It’s the same in the new Chromium-based Edge as well.
I’ve looked at Inspect before and sometimes have wanted to copy some html and paste it into something else (a document, an email). When I right click on a highlighted line, my options are to copy Inner HTML or Outer HTML. I never know what to click. I don’t know what those terms mean. I just want to copy the HTML line that is highlighted. And most times it’s the URL contained within the highlighted line, but I can’t seem to highlight just the URL and copy it.
It’s not really meant for that. Like I warned: it’s really, really geeky and designed for people who really do this stuff deeply. As for urls, I’ve often been able to right click on them and copy link, or click on them to highlight them and then copy.