Leo, my wife and I share a laptop, using Windows and connected to a satellite. The ISP limits our bandwidth. Recently, we received a message that we were using too much: about 150 MB during one recent hour. We do not run any videos, such as YouTube. We just browse some and use email.
Leo, my download speed is abysmal. I should be getting more than enough speed from my internet connection to watch videos non-stop, and yet stop and start and stop and start is exactly what they do. I suspect something else is downloading or something, but I can’t figure out what.
Is there any program which could monitor Internet activity and let me know what’s running?
Yes, there is.
Both of these problems are quite common, and it’s quite frustrating when they arise. With the amount of information now being stored and/or delivered over the internet, our connections are being stressed more than ever.
The technique I’ll describe uses a free tool called Process Monitor. I suspect it’ll be perfect for this problem. While it’s a little geeky, this extremely powerful tool can be used to diagnose many issues, and runs in all versions of Windows from XP to the most recent.
I’ll walk you through how to set it up for this scenario.
Download Process Monitor
We’ll start by downloading and installing Process Monitor.
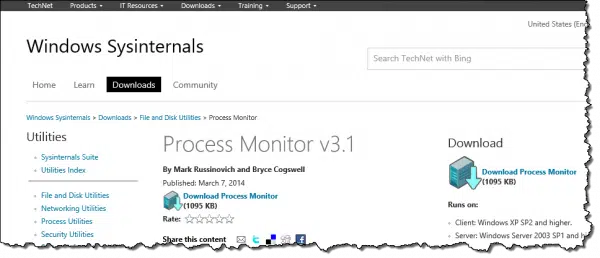
Process Monitor, or simply “Procmon”, downloads as a zip file. Save that to a folder of your choosing and then extract the .exe program from the zipped archive.
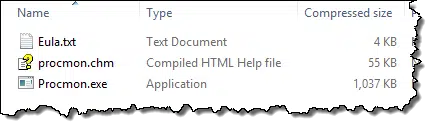
Place procmon.exe and procmon.chm (the help file) in a convenient folder.
How Process Monitor works
Using Procmon is a two-stage affair:
- First, Process Monitor simply collects data, which it calls “events”. To do this we’ll run Procmon for “a while”, and then tell it to stop collecting.
- Second, Process Monitor allows us to examine and analyze the data that it’s collected in several different ways, using filters and summaries.
As we’ll see, Process Monitor collects a lot of data. Fortunately, it also has very powerful tools to make sense of it all.
Run Process Monitor
Run Process Monitor by double-clicking on procmon.exe in whatever folder you placed it. The first time you run it, you’ll need to agree to some license terms. This should only happen once.
Each time you run Process Monitor, you’ll most likely get the User Account Control dialog:
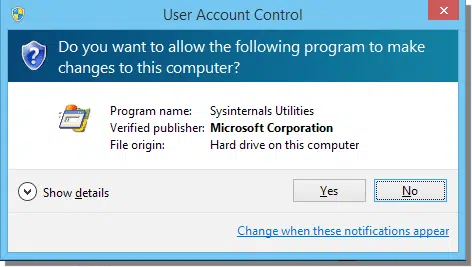
In order for Procmon to monitor the things that it needs to, it must have full administrative access.
As soon as Procmon begins to run, it starts collecting events:
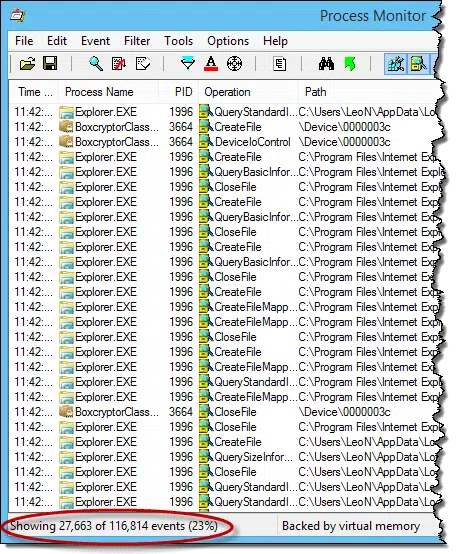
The numbers in the status bar at the bottom will continue to increase as Procmon counts the number of events being collected.
Note that it’s only showing a subset of the collected events. Process Monitor actually includes some pre-set filters that prevent displaying events that aren’t typically helpful, such as all the events generated by procmon.exe itself.
When you’ve collected enough, type CTRL+E or click on the magnifying glass in the Procmon toolbar to stop data collection.
How much data to collect
That’s difficult to say just how much data should be collected by Process Monitor in order to be useful, because it really depends on the specific situation that you’re attempting to diagnose.
The simple rule of thumb is to collect data while the problem you’re experiencing is happening. In general, I start it when I know or suspect that a problem is happening, (like your unknown internet usage), and let Procmon collect until the problem has indeed happened and occurred long enough to have generated meaningful data.
Depending on the problem you’re experiencing, this might take some experimentation. Procmon discards its data when you exit, so there’s no problem at all running it multiple times experimenting with the timing or duration.
Analyze Process Monitor results
As I mentioned, Procmon includes a fairly powerful filtering interface which is on the Filter menu. This interface really is quite complex, because it assumes you know a little bit about how Windows works internally. But don’t worry, we won’t use it here.
Instead, Procmon also includes some summary analysis tools that make what we’ll do next fairly easy.
On the Tools menu, click on Network Summary…
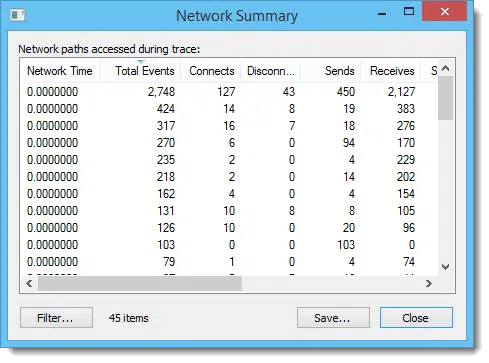
Unfortunately, the default width of this dialog actually hides some interesting columns. Fortunately, the dialog is resizable, so click and hold on the right border and drag it to the right to make the dialog wider to expose the “Path” column:
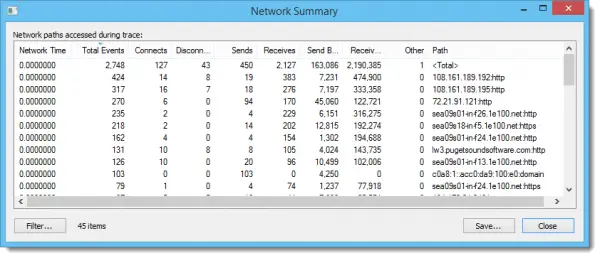
This is a summary of all the network-related events that have been captured. Initially these are sorted by decreasing number of events, but the column headers are all clickable. In the example above, the next-to-last column is labeled Receiv…, which is truncated from Received Bytes. I’ll click on that to see which event has been downloading (aka receiving) the most data:
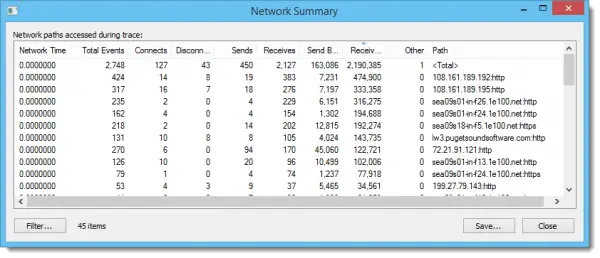
Here, we can see that during this capture, my machine was downloading a lot of data from 108.161.189.192, on the http port. The problem is that doesn’t really tell us what program is doing the downloading. Not to worry, Process Monitor makes that easy.
Double-click on the line of interest and the Process Monitor main window will update to show only the events related to that line. (You can close the Network Summary window if you need to, in order to see Procmon’s main window.)
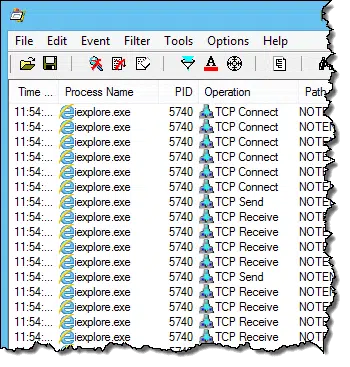
Sure enough, it was Internet Explorer running on this machine. In order to show something interesting, I visited Ask Leo! in the browser and browsed a few of the articles there.
In many cases, Process Monitor will show you the “reverse DNS” for the IP address that the computer is connecting to. In other words, it’ll show you a traditional domain name like lw3.pugetsoundsoftware.com, the server that currently hosts Ask Leo!. In cases where there is no reverse DNS, the IP address is listed. Our example IP address, 108.161.189.192, is owned by “NetDNA”, which is the content delivery network I use to speed up AskLeo! page loads. http://whois.domaintools.com will show you the ISP or other major provider that owns an IP address (though it cannot show you specific users or computers).
The one-machine assumption
One final note on using Process Monitor: this analysis assumes a single machine connected to your internet connection. Other machines on your local network should be disconnected or turned off for this analysis to really have meaning. Network activity from other machines could impact your internet connection in terms of both quantity and speed.
If you have multiple machines, my advice is to repeat this process on each machine. Unfortunately full-network traffic analysis is difficult to come by. There are high-end routers and traffic analysis tools, but by and large they are all significantly more expensive and complex than would make sense for the home or even small business user.
Help keep it going by becoming a Patron.
Speeding up your connection
The goal in using Process Monitor has been to collect data to allow you to identify what programs are making heavy use of your internet connection.
What happens next depends on what you find, and what decisions you can make.
In many cases, you may find that the program identified can be reconfigured so as not to make such heavy use of the internet. Perhaps you can turn it off completely by not running it or by not leaving it running.
In other cases you may determine that while you do need to run whatever it is you’ve found, you can run it or use it at a different time so as not to adversely impact something else that you’re doing.
And, naturally, it’s also quite possible that you’ll find you simply need a faster connection to meet your needs, or a connection with a higher data cap.
The bottom line to speeding up your connection without that last step remains simple: move, remove, or disable the programs or activities that are competing for your internet bandwidth. Doing so will free it up and make more of it available to the programs you leave running. The net result is a faster internet experience.
More Procmon
We’ve only scratched the surface here, but as you can see, it’s fairly easy for such a powerful program to quickly generate a summary analysis of many common operations, not just network access. While you’ve got Procmon open, spend a few moments, particularly with the other items on the Tools menu, to see how it might help you face other issues in the future.
In tracking down your network usage just running Procmon for a while as you experience your issue should allow it to gather enough data such that the Network Usage Summary can tell you exactly what program is downloading all that data.

I used to have the same problem with my satellite ISP (wildblue). Their site offered an online portal that you could log into and see where you are on the rolling 30 day scale. What it didn’t show was a day-to-day graph that might allow you to see that, for example, once a specific date drops out of the 30-day window, it will “free up” more bandwidth for the remaining period.
I also used a free tool called BitMeter (available at Download.com) to monitor traffic. I would imagine with this product and Leo’s suggestion, you could quickly get a handle on the bandwidth consumption.
I feel your pain: that cap forced me to move to the highest/priciest package to handle the traffic required for my work-at-home freelance business. Fortunately, DSL eventually came my way and I immediately jumped on it.
Same problem with my ISP.. When I went over the very first time, they told me they would cut me off for 30 days if it happened again.. and after a 3rd time, they’d cut me off for a year!!!
Fortunately I stumbled across a great FREE network monitoring program called Networx (http://www.softperfect.com/products/networx/) It will not only track and total up all usage on multiple computers (I have more than one), but you can even set it to shut down your computer if it exceeds a certain amount of bandwidth (which you set yourself).. Very easy to use and haven’t had a problem since I installed it about a year and a half ago… Even though you only have the one laptop and share it, it would still work just as well… and if you ever do get an 2nd computer, you’d be set.. If you travel or use your laptop away from home, you can even set it to ignore all traffic outside your home network (which is great when I take my laptop to work).
Have they turned on security on their modem?
I wont mention who but ….I discovered that my ISP with whom I had a dedicated account , had been ILLEGALLY proxying my port on the NAT server with 1 other user [ to save a few $$$ ] discovered when certain sites were continually telling me I was ALREADY downloading something, I had exceeded my 24hr download limit, or I already was logged on to the site from the same IP address but port 1080. 🙂 my speed was less than v90 on ADSL2+ , after informing my ISP I had a record of what was going on, my speed jumped to 1.5MB overnight. There ARE free tools to catch this little number and don’t kid yourself; most people haven’t a clue but when you have 150 users on a 100 port rack, things don’t add up.
10-Feb-2011
On a win vista OS after unzip all 3 files never open and I have to use task mng to kill not responding. And what information I find is limited.
was starting with (open with admin prompt) but it took going into the properties menu and checking start as Admin. So now it is running but I am not getting any results when I choose the networking filter or summary only zeros all across. Maybe the firewall ?
All I want to do is make a copy of the registry. Install a program. Make another copy of the registry and compare, to see the changes.
A) Run a tool like Procmon, which will allow you to filter on all registry writes by a specific application so you can see what that application is doing.
B) Run regedit.exe, select the “Computer” item at the top of the registry tree, and then select File->Export and export the entire registry to a “.reg” file. Do that before and after whatever it is you want to monitor, and then use a file difference tool like winmerge to scan for differences.
12-Dec-2011
I installed a free tool called NetSpeedMonitor, which shows how much data is currently uploading/downloading in your system tray. It also lets you see the total data traffic for each day. This data is only for the computer it’s installed on. My only internet option is through my cell phone company and of course has a data limit. I started logging the data usage throughout the day to get an idea as to what activity was using the most data. I quickly found my biggest offender. It was the auto-play feature for videos on Facebook. So every time I hovered briefly of a video, it would automatically download and start playing. I cut my data usage considerably by turning off this feature (Settings > Videos). I also turned off this auto-play feature within every Facebook app we have installed on our mobile devices.
Don’t forget Resource Monitor. It’s built in to my Win7 and I was able to sort by highest download volume. (My high consumer and problem was WDDriveService.exe, part of Western Digital external hard drive software. Unbelievable!).
I also found Networx and it was a great free monitoring tool for data consumption.
Actually have an article on resource monitor: http://askleo.com/monitoring-your-system-with-resource-monitor/
Resource Monitor built into Win7 (and probably 8 also) Will show you what is consuming data from the internet and many other things.
process monitor is NOT a free “download”. you can download the program, then they want you to pay $42.97 to use it. sorry, it’s on sale for $32.97 until september 6th.
That’s simply not true. As long as you get it FROM MICROSOFT, it is completely, 100% free. If you get it from somewhere else, or you get something else that has the same name, then maybe you’d see what you’re seeing.
I’m new, but FINALLY!.Thank you.
I like an Internet/network monitoring application called ‘Glasswire’. It is available in both free and paid versions at https://glasswire.com.