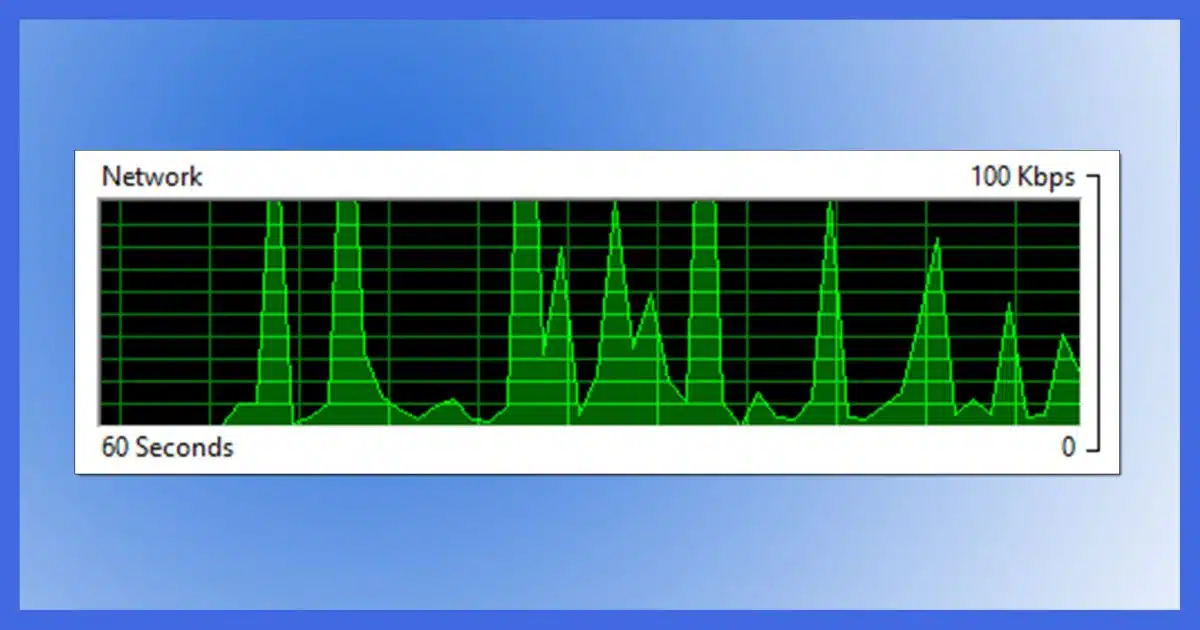
There’s lots of activity to monitor.
My normal response for this type of problem is to turn to Process Monitor, a free SysInternals utility from Microsoft. The problem is, it’s a pretty geeky tool. It requires a little patience and understanding to get useful results.
Of late, I’ve found myself firing up a utility that is already included in Windows to monitor network activity. It quickly displays a lot of information about what’s going on. It can monitor several areas of your computer’s activity, but I’ll focus here on networking.
Become a Patron of Ask Leo! and go ad-free!

Monitor network activity
Resource Monitor is an excellent Windows tool for monitoring network activity. You can see which programs are using the network, how heavily, and with what remote servers they are communicating.
Resource Monitor
Click on Start and begin typing “resource monitor”. Click on Resource Monitor when it appears.

In Resource Monitor, click on the Network tab.
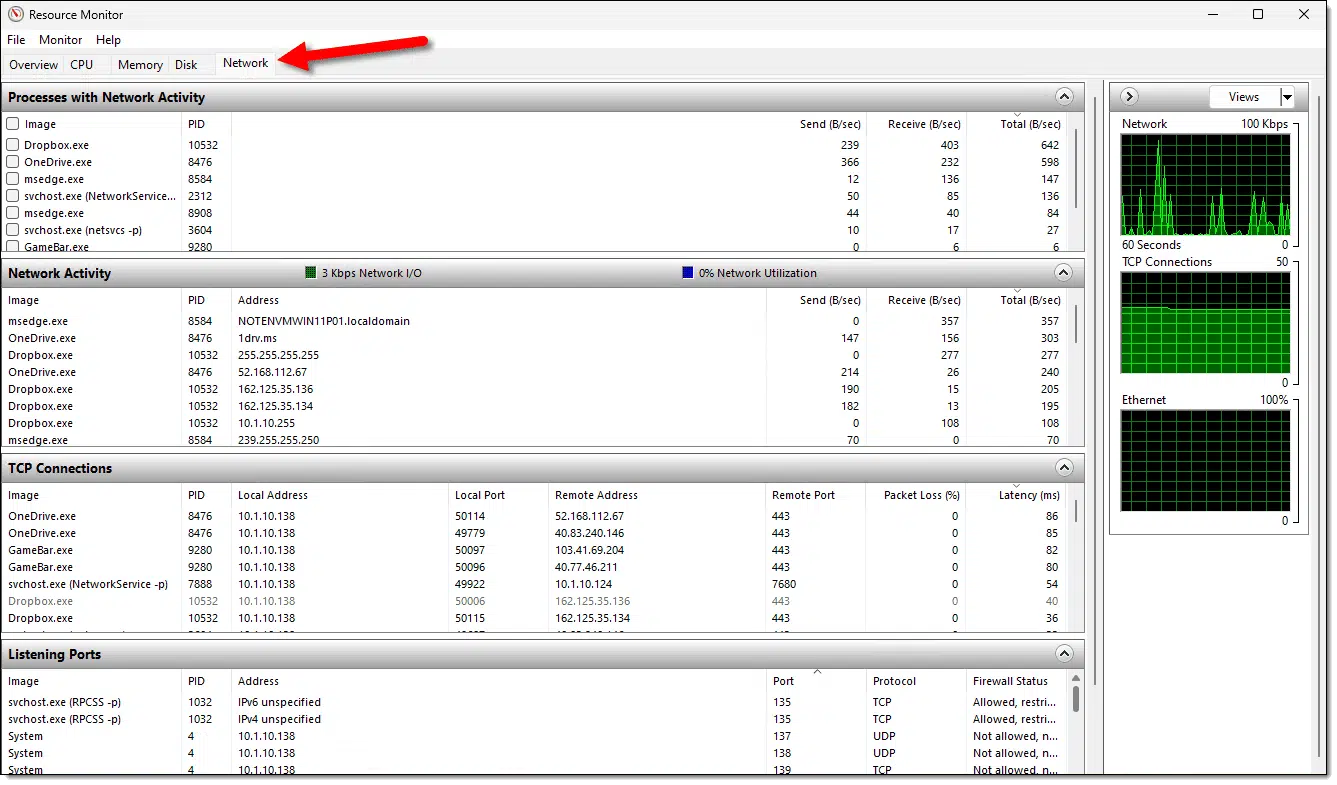
Here you’ll find several panes of information about the network activity happening on your machine. (You may need to click on the title bar to open them. You can then also click and drag the dividers between panes to make them smaller or larger.)
Network Activity Graph
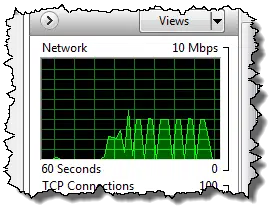
At the top of the right-hand column, you’ll see this graph, which shows the average network traffic total for the last 60 seconds.
Be forewarned: the scale will change automatically based on traffic. In the example above, the scale is 10mbps, or 10 megabits per second, and the graph peaks at around the 4mbps range. If the traffic slows for long enough, the scale will change to 100kbps, or even 10kbps, so that even at lower traffic rates, the spikes of traffic can be viewed. It’ll also scale higher should network traffic exceed 10mbps long enough. Pay attention to the scale to understand how much data is being transferred.
Processes with Network Activity
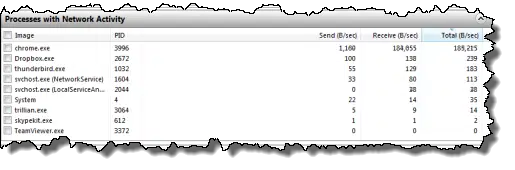
This pane lists the processes that are actively doing some kind of network I/O (input/output, a fancy way of saying activity). You can click the column headers to sort by their contents. I find sorting by Total to be the most interesting. In the example above, we can see that when I took this screenshot, chrome.exe — the Google Chrome browser — was performing the most networked I/O, followed by Dropbox, Thunderbird, and others.
Network Activity
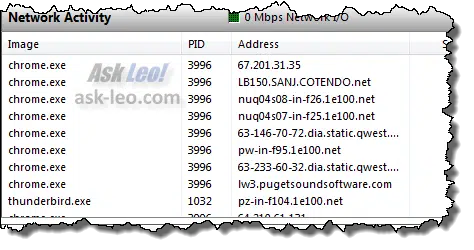
I find this perhaps the most useful pane. It lists the processes that have network activity and the remote endpoints to which they’re connected. Not shown above (but off to the right) are the same Send/Receive/Total bytes columns so you can see which connection is generating the most traffic.
In the example above, the most active connection is to an IP address: 67.201.31.35. A little research shows that this IP address belongs to NETDNA, the content distribution network I was using for Ask Leo! when I took this screenshot. I was downloading an Ask Leo! page with images to generate some example traffic.
You can see additional connections to “cotendo.net” (another content distribution network), “1e100.net” (which turns out to be Google — I have Google sites open in my browser, and the example page that I used to generate traffic includes Google services), and “lw3.pugetsoundsoftware.com” (the server housing Ask Leo!).
TCP connections
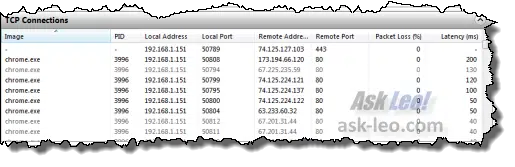
This pane lists all the network connections established by programs running on your PC whether or not they are actively transmitting or receiving data. This can be useful to see what programs are connecting where out on the internet.
Listening Ports
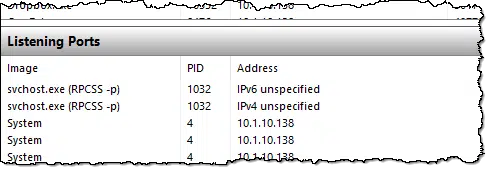
This is generally less useful, but “Listening Ports” lists those processes that are ready to accept a connection from another machine on your network. In most cases, your router limits these connections to come only from machines on your local network and not the internet. For example, file sharing: if you want to copy a file from machine A to machine B, the file-sharing software on machine B needs to be listening to accept the incoming connection.
TCP Connections Graph
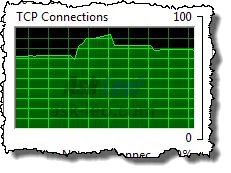
This graph shows the number of connections being made between your machine and others across the network over time. Like the Network Activity graph, it also auto-scales, so watch the maximum number shown to get a sense for what the graph is showing you.
Filtering
Given that there’s a lot of software running on your machine, the amount of information displayed can be overwhelming. Fortunately, Resource Monitor allows you to filter the information.
Each of the processes listed in “Processes with network activity” has a checkbox. Check the box in front of the process you want to explore in more detail.
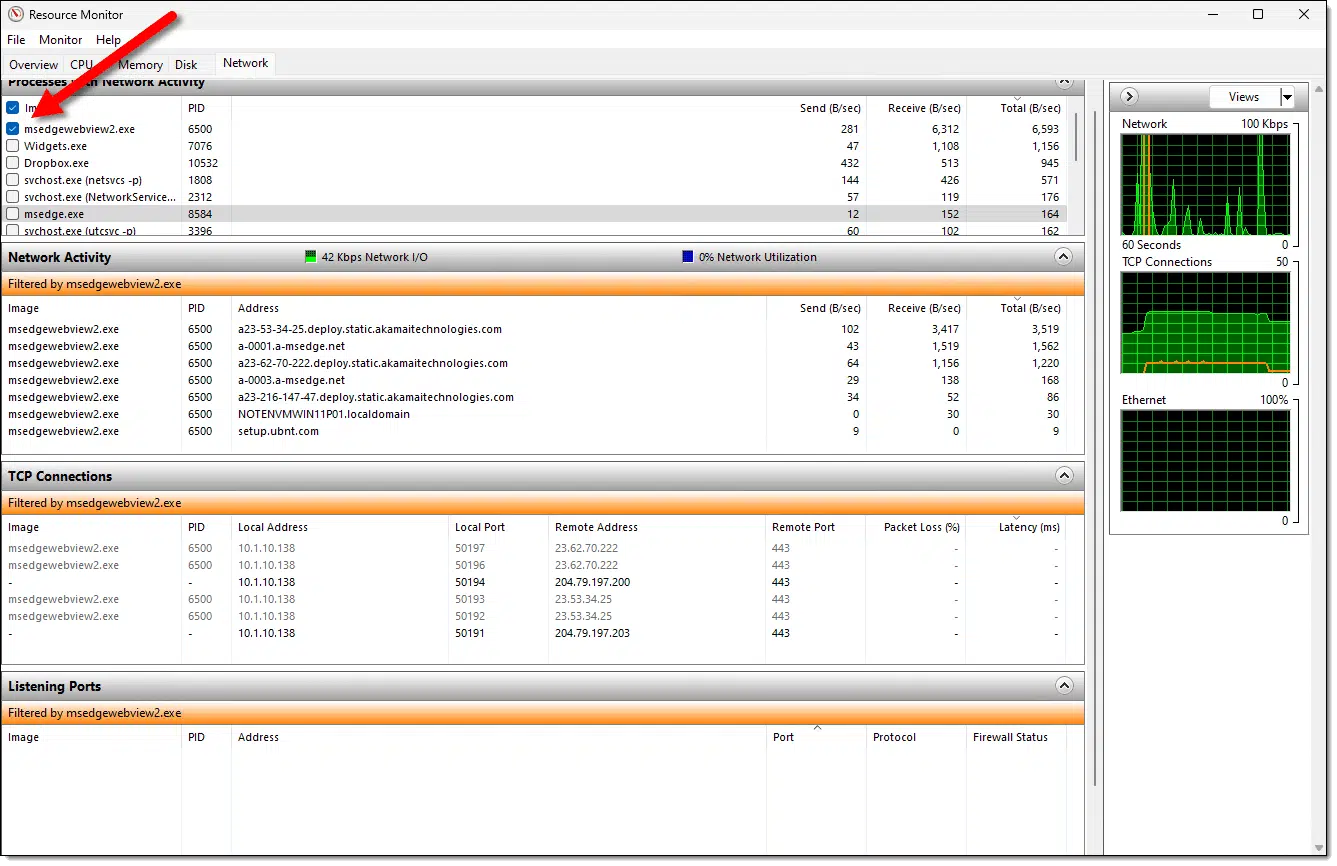
Now the panes below will show only items related to that specific process. In the example above, I clicked on msedgewebview2.exe, a component of the Edge browser. The Network Activity, TCP Connections, and Listening Ports panes now show only items related to it.
Do this
Resource Monitor’s network monitoring pane provides a quick and informative window to monitor network activity happening on your machine. It will tell you what remote sites your computer is connected to and which of the applications on your machine are responsible for network traffic. Those two bits of information alone can often resolve many of the questions you might have about what’s happening on your machine.
Speaking of resolving questions, that’s kinda what I do.  Subscribe to Confident Computing! Less frustration and more confidence, solutions, answers, and tips in your inbox every week.
Podcast audio

Related Video


Ah yes, resmon. But — ahem — why is it called “resmon” and not “netmon”? (And IS there a “netmon” apart from “resmon”?)
Because it monitors more than just the network. It also monitors the CPU, the RAM, and disk activity.