Resource Monitor helps you understand what’s happening.

When diagnosing a system problem or monitoring the health of a working system, it’s useful to peek “under the hood” to see what’s going on.
Windows includes a utility called Resource Monitor that does just that. It provides more information than Task Manager without getting into all of the esoteric and often confusing detail of Process Explorer.

Using Resource Monitor
Resource Monitor provides information about what’s happening on your system organized into four areas: CPU usage, Memory usage, Disk usage, and Network usage. A tab representing each area displays detailed information that can be used to understand system behavior and diagnose issues.
Overview tab
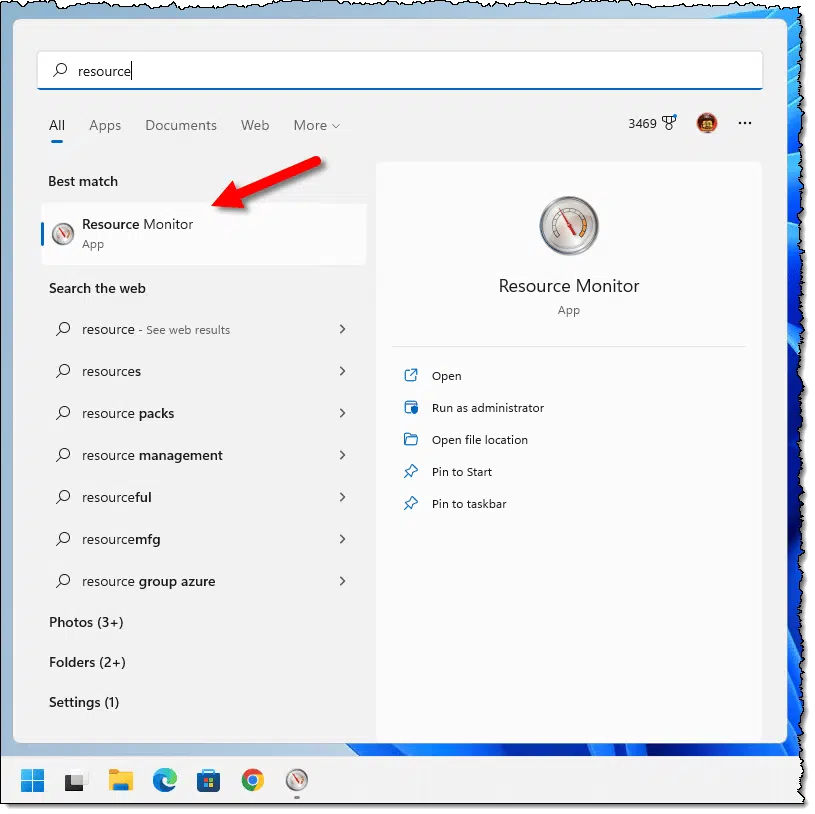
The easiest way to run Resource Monitor in Windows 10 and 11 is to click the Start menu and start typing “Resource”. Click on the Resource Monitor icon when it appears in the results.
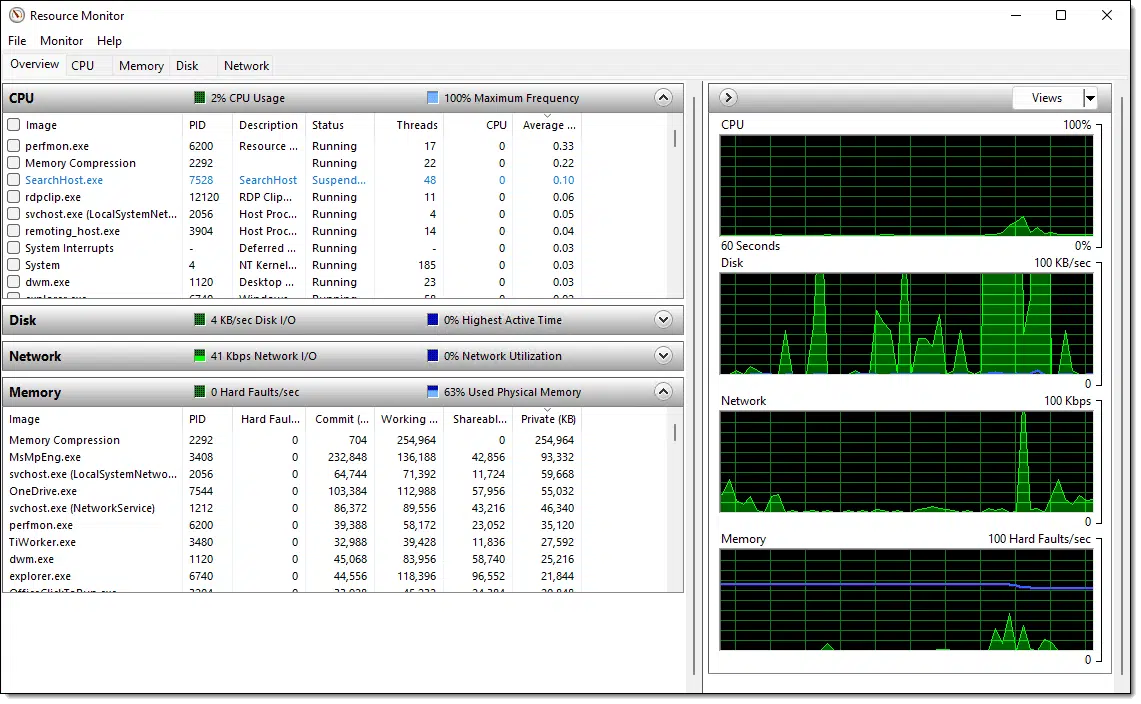
As shown at the top of the page, it will begin displaying the Overview tab, an overview of activity on your system. (If you’ve run it before, a different tab may be shown — click on the Overview tab to follow along here.)
Results can be sorted by any column. Here, I’ve sorted the upper CPU pane by Average CPU Usage (“Average …” in the image). This is perhaps the most useful sort; it shows the processes running on your machine in decreasing order of CPU usage. You can see that perfmon.exe, which is actually the Resource Monitor program itself, is currently using 0.33% of the available CPU.
The lower pane, Memory, is sorted by the Private column, one of the indescribable but useful numbers measuring RAM use. Here, you can see that “Memory Compression”, a memory management helper, is using the most RAM, with MsMpEng.exe (Microsoft Security) the next in line.
Off to the right are graphs associated with some aspect of each of the tabs. The CPU graph shows total CPU usage. Disk and Network (each of which we’ll explore in more detail in a moment) graph total disk and network activity, respectively. And the Memory graph at the bottom shows “faults” per second. These aren’t errors, but reflect how frequently the memory manager reads from disk.
You can expand or collapse any of the four panes by clicking on the pane’s title bar.
Let’s look at more of the information provided by the tabs across the top.
Help keep it going by becoming a Patron.
CPU tab
The CPU tab expands on the information presented in the Overview’s CPU pane.
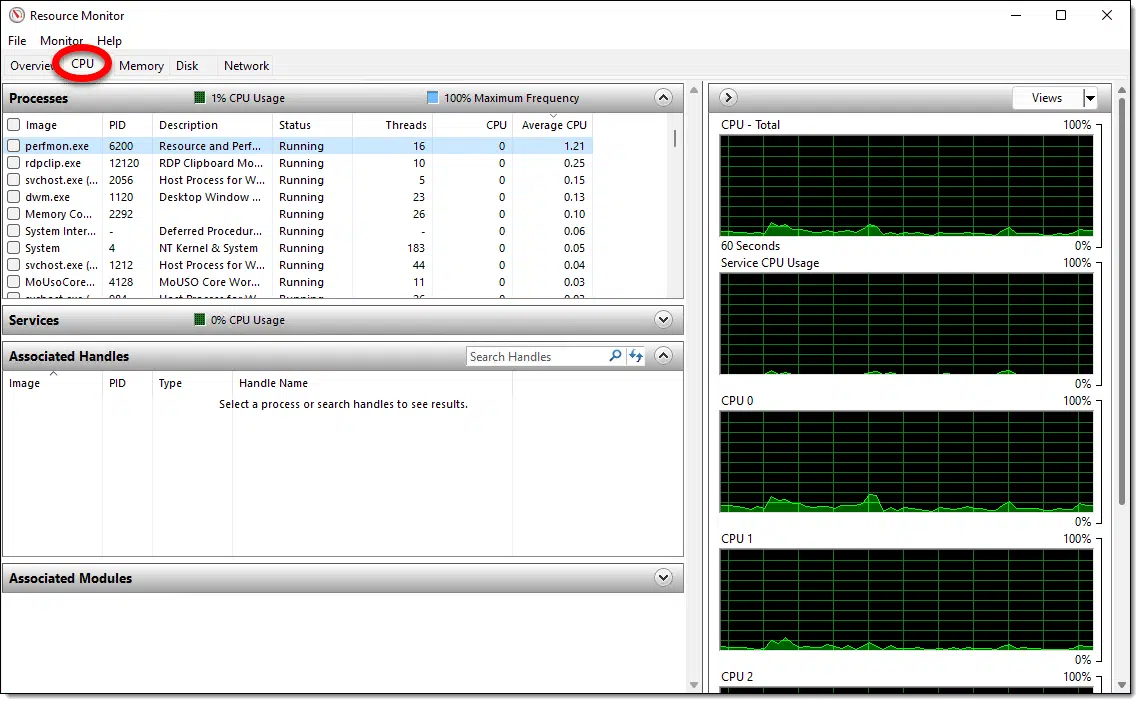
Once again, it has four panes of information and a couple of graphs.
The Processes pane is very much like the information presented in the Overview, Process Explorer, and even Task Manager. Once again, you can sort by the different columns and examine information about each process.
The Services panel looks at the various Windows “services” — support services and functionality provided by background processes in Windows. You can see which services are running and explore their individual CPU usage. (This is difficult to see with other tools, because many services can be bundled into the same program and those tools only provide information to the program level.)
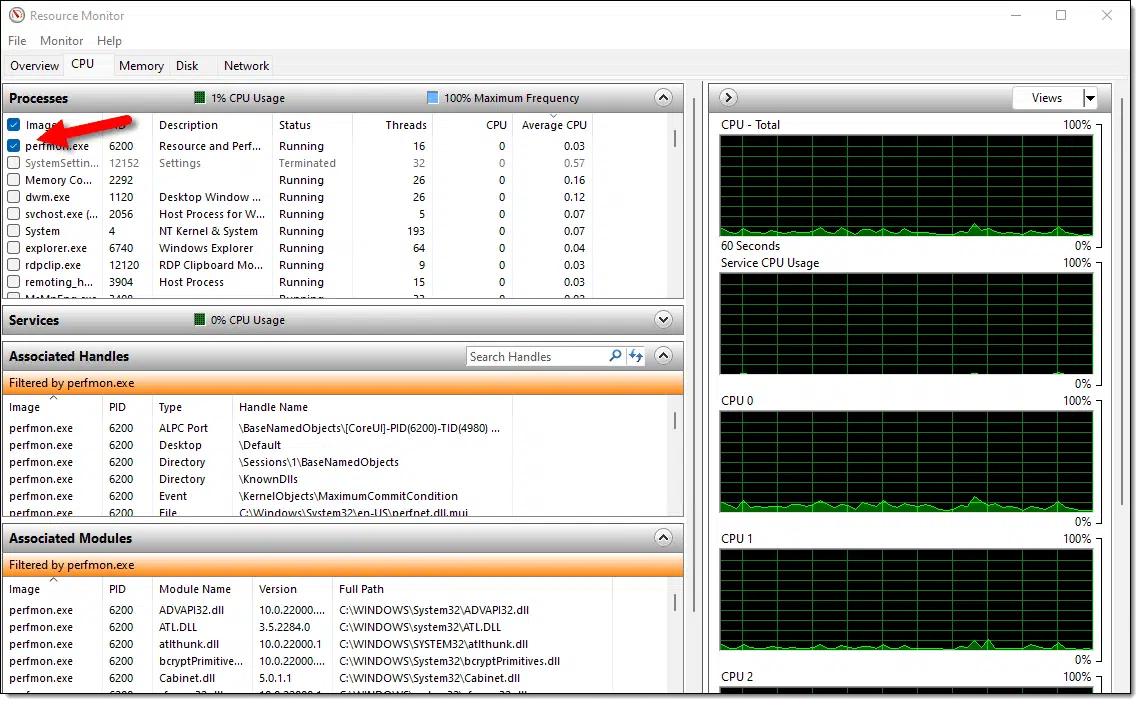
Associated Handles is where you’ll find what open files and other resources the selected process in the Process list above uses. Associated Handles is more than just files. Many system resources, from network connections to areas of RAM to registry keys and more, use “handles,” so they’re listed here.
Associated Modules lists any modules that are in use by the process selected in that first list. In this case, “Modules” refers to the files used as part of this program. The list includes those DLLs that were provided as part of the program’s installation as well as all Windows component DLLs and resources that the application uses.
Here’s an example of both Associated Handles and Associated Modules listing items associated with the selected program, perfmon.exe.
When the CPU tab is selected in the right-hand pane, graphics display the historical total CPU usage as well CPU usage by system services and for each processor core.
Memory tab
The Memory tab displays the memory, or RAM, usage of the various programs running and the system as a whole.
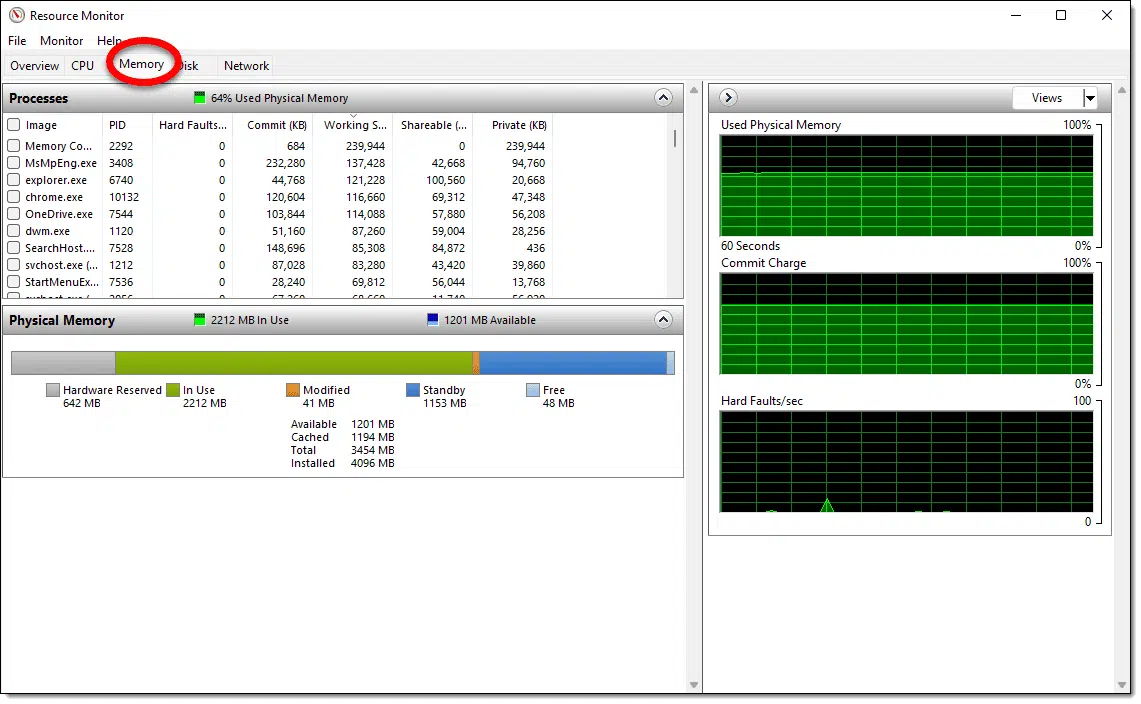
There are only two panes: a Processes pane showing information about each running process, and a Physical Memory pane presenting an overview of the computer’s RAM usage.
The most interesting columns in this view are the “Commit” and “Working Set” columns. Without getting super geeky, these columns reflect two measures of the memory being used by the processes listed. When I’m concerned that a process uses too much RAM, I look at these numbers.
The important graphs on the right1 are overall Used Physical Memory and Hard Faults. Once again, Hard Faults is a measure of how often the computer uses the hard disk to manage its RAM. Some usage is normal; programs are often loaded from disk with a technique that manifests as “faults.” On the other hand, when the system is out of RAM and swaps excessively to disk, Hard Faults will skyrocket as system performance suffers.
Disk tab
The Disk tab presents useful information about what processes access specific files on the various disks attached to your system.
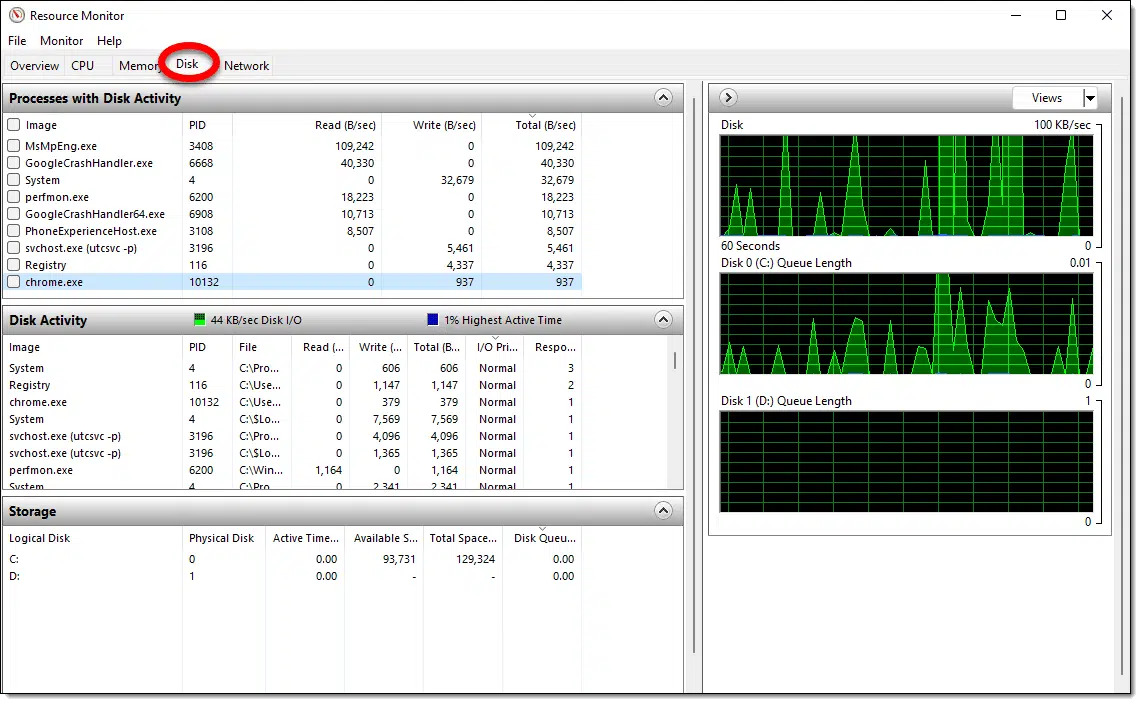
The top pane, Processes with Disk Activity, is a list of processes currently accessing the disk and a couple of measures of how much data is being read and written.
The second pane, Disk Activity, breaks down disk activity to the file level so you can see exactly which process accesses which file and what kind of read or write activity is happening.
The Storage pane presents information on disk activity at the drive level.
The graphs to the right include an overall disk activity meter as well as a reflection of how much work is waiting to be handled for each disk in the system.
Network tab
The Network tab focuses on the networking activity of the processes running on your machine.
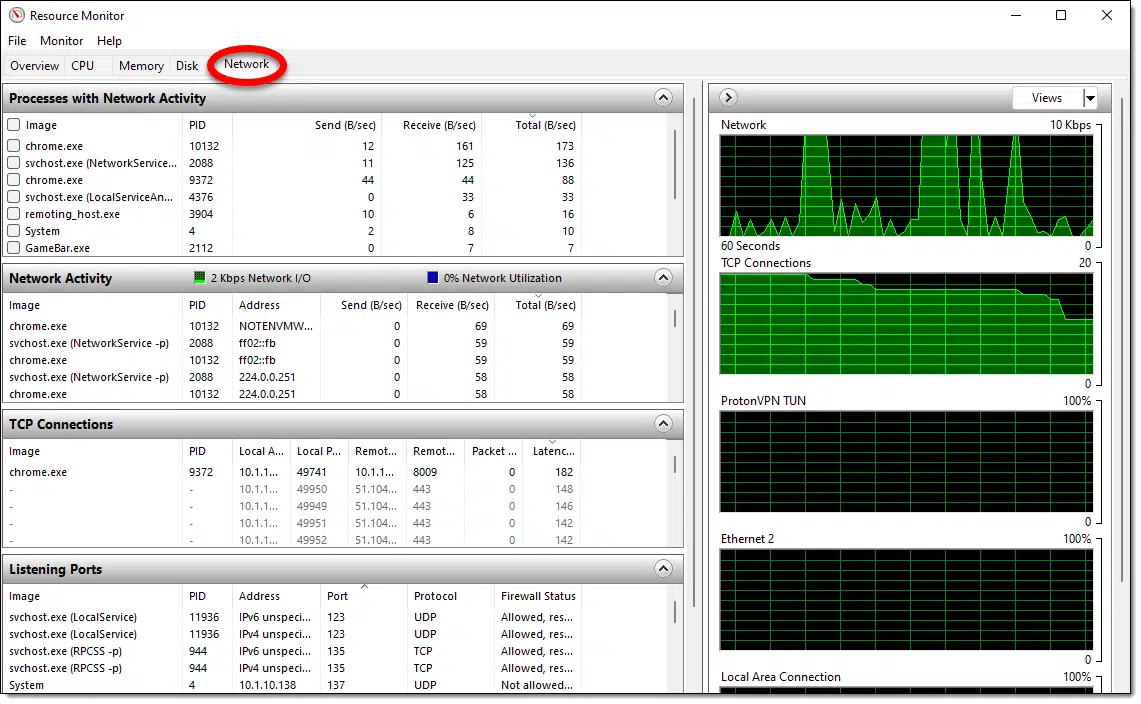
Much like disk activity, the upper pane — Processes with Network Activity — shows the processes on your machine accessing the network and how much data is transmitted. As we’ll see in a second, “the network” includes both local and internet access.
Network Activity is perhaps the most interesting pane here. This shows you the connections for remote IP addresses or local names processes and how much data is being transmitted or received.
TCP Connections lists processes that are connected to other machines on the local network or the internet regardless of whether they transfer any data. These connections might be idle because they’re not transferring any data at that time, but rather than disconnecting and reconnecting each time, they stay connected.
Listening Ports is the reverse of connections. This represents processes on your computer configured to accept a connection from a remote computer. In most cases, your router or firewall blocks connections from the internet that use these listening ports. But when you want to copy a file from one machine to another across your local network, one computer contacts the other by making a connection via one of these listening ports.
The graphs on the right detail overall network data transfers and the number of connections. They can also break out the amount of data transferred if you have more than one network interface.
Do this
I’ve obviously only scratched the surface in discussing the things Resource Monitor can do. It can’t do everything, but it can provide a very useful window into the behavior of your Windows machine.
My recommendation is to fire it up, play with it a little, and explore what it can show you. When you experience a problem, consider using it as a diagnostic tool. It might show you something helpful.
I’ll show you something helpful every week if you subscribe to Confident Computing! Less frustration and more confidence, solutions, answers, and tips in your inbox every week.
Podcast audio

Related Video


Footnotes & References
1: “Commit Charge” is another one of those geeky rabbit holes that is best ignored here. If you’re just itching for a definition, Wikipedia has one. Good luck. 🙂

Very nice article on using Resource Monitor, Leo. One thing: Microsoft, for reasons unknown, changed the location of this program in Windows 8… Windows Accessories – System Tools now contains only Character Map. For those using Win8, Resource Monitor feature is now found in “Administrative Tools.”
I like Win8…with the Classic Shell add-on…but that alteration of the Start menu seems to be an unnecessary change for “newness” (ok, color me a bit cynical). Memo to designers of software, and hardware: “New” does not always mean “improved” for users accustomed to an arrangement that worked, and made perfect sense.
Windows 7 —
There is a Resource Monitor button in Task Manager’s Performance window.
If Resource Monitor shows a window frame with no content, look to see whether you have KB2670838 installed. Uninstall it to make Resource Monitor happy.
http://answers.microsoft.com/en-us/windows/forum/windows_7-windows_update/after-windows-update-kb2670838-the-resource/b923f5bb-fb9f-44da-b6ab-1745ee7f13b8
Hi,
great article, as always, thanks!
Looks like Leo’s “used physical memory” green/black image fills only 2 out of 10 rows! Mine fills 8 out of 10!
so what does that mean?
I don’t see a way to insert the image here?
thanks
Denise
MS has released a beta version of its new PCManager. I downloaded it & it looks very useful. Will you be doing an article on it, maybe post beta?
On the CPU tab, at the top of the list, there is a “6%CPU Usage” box that is self-explanatory and a “113% Maximum Frequency” box. When I look at your screenshot you have a “100% Maximum Frequency” box, does that mean I have a problem? I can’t find any explanation of what the range of this should be.
John Tyler: The maximum frequency percent is an indication of the CPU’s clock speed relative to its nominal clock speed spec. For most users this is meaningless. It’s especially meaningless because, as you said, there isn’t much precise information about how it’s measured. Is it an instantaneous measure, an average over time, over how long a time, for one core/CPU or an average of all cores/CPUs, etc? The OS adjusts the CPU clock speed as needed. It can be indirectly lowered by lowering the computer’s power usage, such as on a laptop. Also, you may be able to adjust it with command line commands, in the registry, in the BIOS or using some third party utilities. Don’t do it! If your computer isn’t getting hot and works as expected, leave well enough alone. What’s more important is the CPU usage percent, which will change depending on what’s running. If the CPU usage remains very high for a long time AND the frequency is also over 100% at the same time, then there is something sucking up CPU resources. You will readily notice that situation. But that should be a temporary situation, unless some malware is doing it.