When you want to see what’s really going on.
You may not need, or even want, to know what’s going on under the hood in Windows. Most computer users shouldn’t have to. Computers are supposed to just work, and you should never need to be bothered with things like processes or resource utilization.
And yet, there are times when we want, or even need, to know.
This is where Process Explorer comes in. Process Explorer — also called “procexp” — provides a window into all the programs running on your computer at a level of detail that Task Manager doesn’t.

Process Explorer
Process Explorer is a free, powerful tool that shows everything running on your computer in detail. It beats Task Manager with features that dive deeper, even showing system trends over time. It’s a must-have for troubleshooting and understanding your PC.
Task Manager is good, Process Explorer is better
Task Manager in Windows 10 and 11 is a good tool, and it’s gotten better since its earlier incarnations.
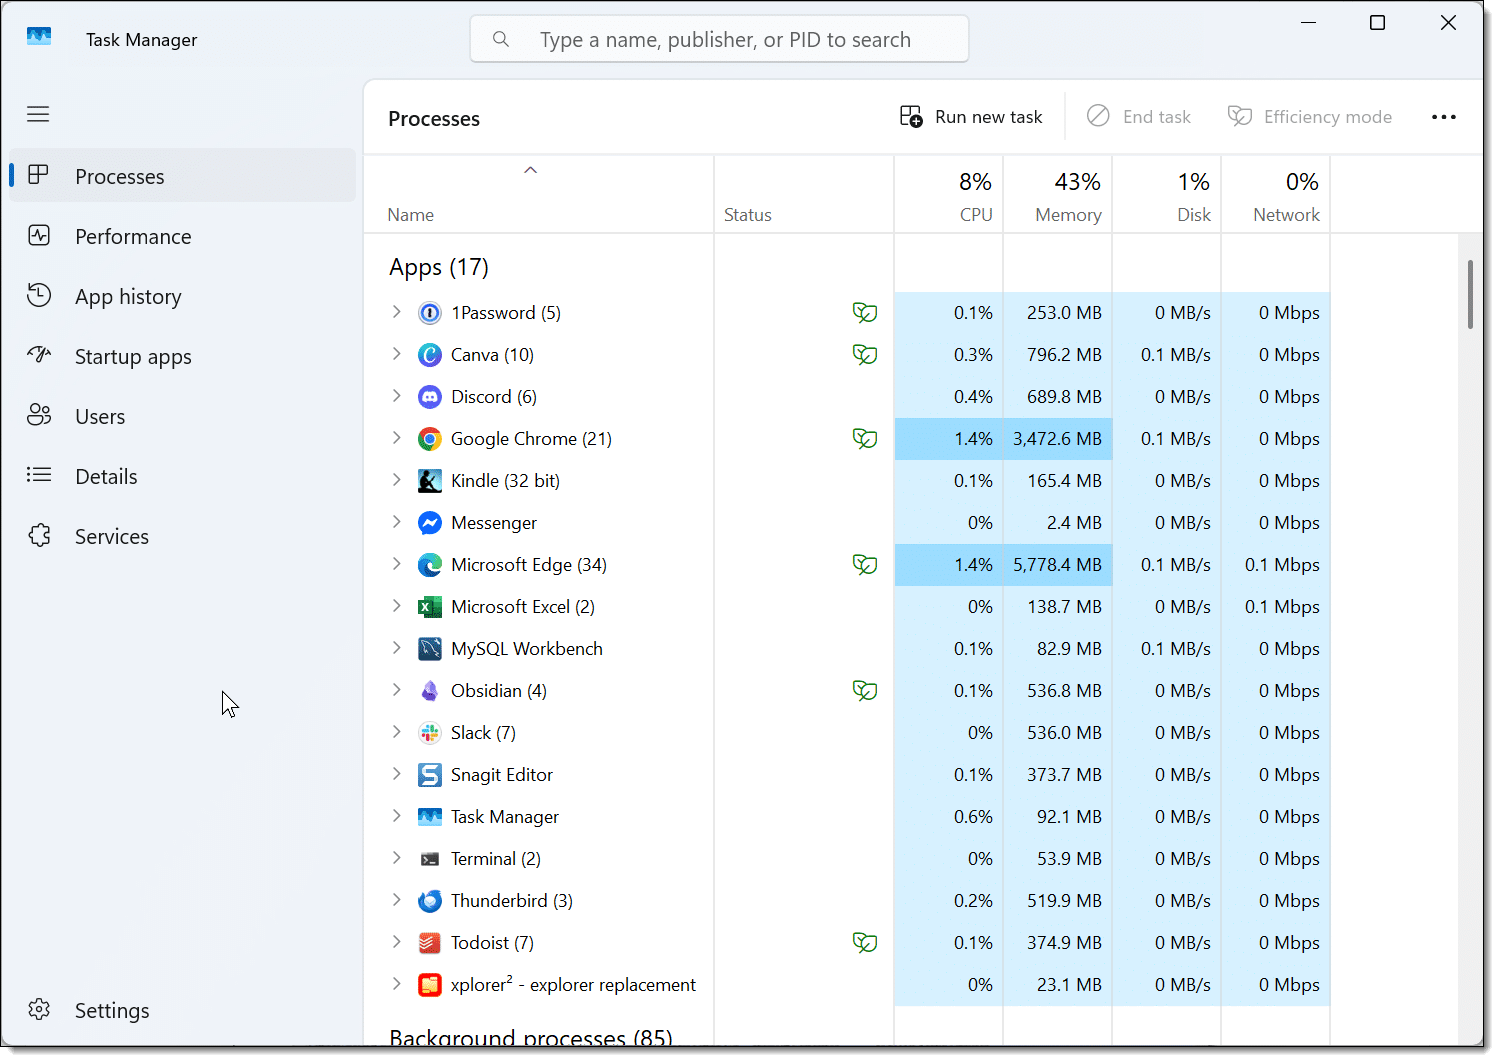
While past versions of Task Manager were woefully inadequate for diagnosing system activity, the current versions do provide more visibility into just what programs are running — both the foreground programs you see, and the background programs you don’t. Often that’s enough.
But sometimes we need more.
Help keep it going by becoming a Patron.
Process Explorer
Process Explorer is included in the SysInternals suite of tools, which can be installed for free from the Microsoft Store.
It’s hard to list all the types of things you can do with Process Explorer. It’s like a Swiss-Army knife of system utilities, and it has many, many potential uses.
When you fire it up, you’ll get exactly what you might expect: a list of the processes running on your machine.
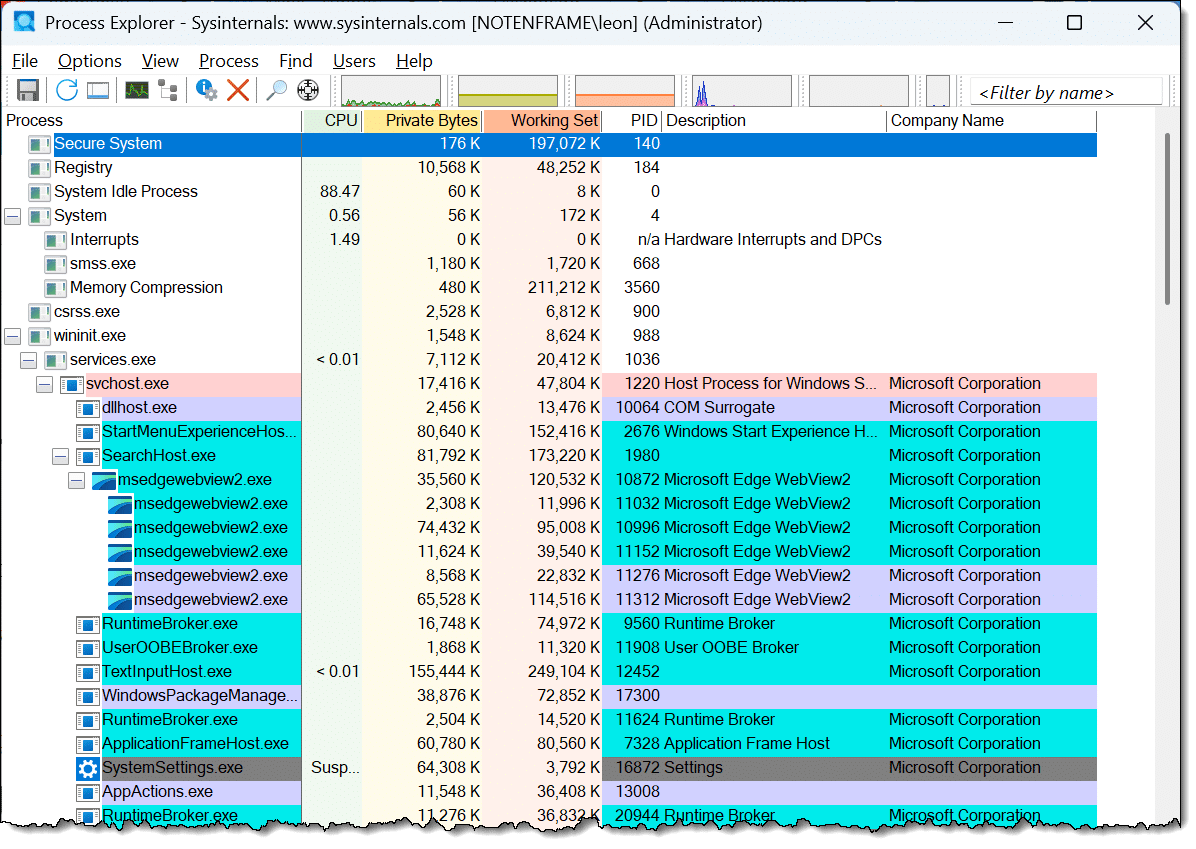
The list includes all tasks, or “processes”, running on your system. The “hierarchical” view (click on the “Process” column header to change the view from alphabetical to hierarchical) shows which processes started other processes, which can be a very interesting way to understand how they all relate to each other.
CPU usage
Click on the “CPU” column header, and the processes will be listed in order of which program is using the processor most heavily. This is updated every few seconds and is perhaps the single most common use of procexp: to answer the question “What’s using the CPU the most?”
Memory usage
Click on the “Working Set” column header to list processes in order of physical memory (RAM) used. As you might expect, this is the next most common use: to answer the question “What’s eating up all my memory?” The “Private Bytes” column does roughly the same, but includes memory that may have been swapped to the system paging file.
CPU and memory are probably the most commonly used columns. You can find out more about the others (and, indeed, a list of additional columns you can monitor) in Procexp’s help.
Finding things
The “Find handle or DLL” function is a quick way to see, for example, which process is using a file. Enter a partial filename, and procexp will list all the processes that are referencing a handle (typically a file) that includes that name.
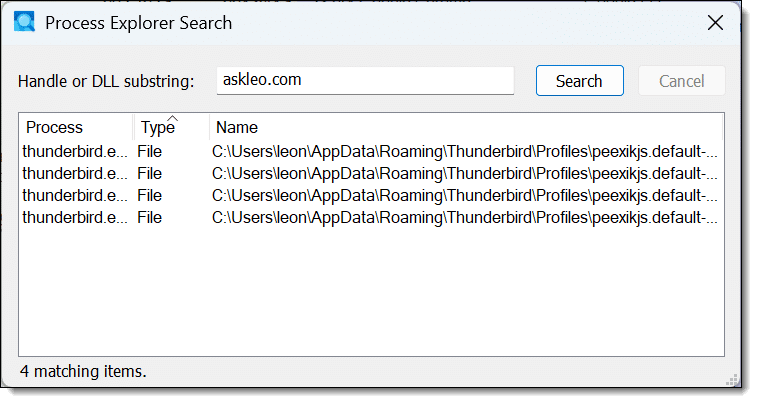
In the example above, I searched for “askleo.com”, which returned the fact that Thunderbird has several files open that include that as part of the filename (not visible, but off to the right in the dialog) as it accesses my askleo.com email.
Process details
Process Explorer also lets you dive into individual processes for more information. Right-click on any process and click on Properties for more details.
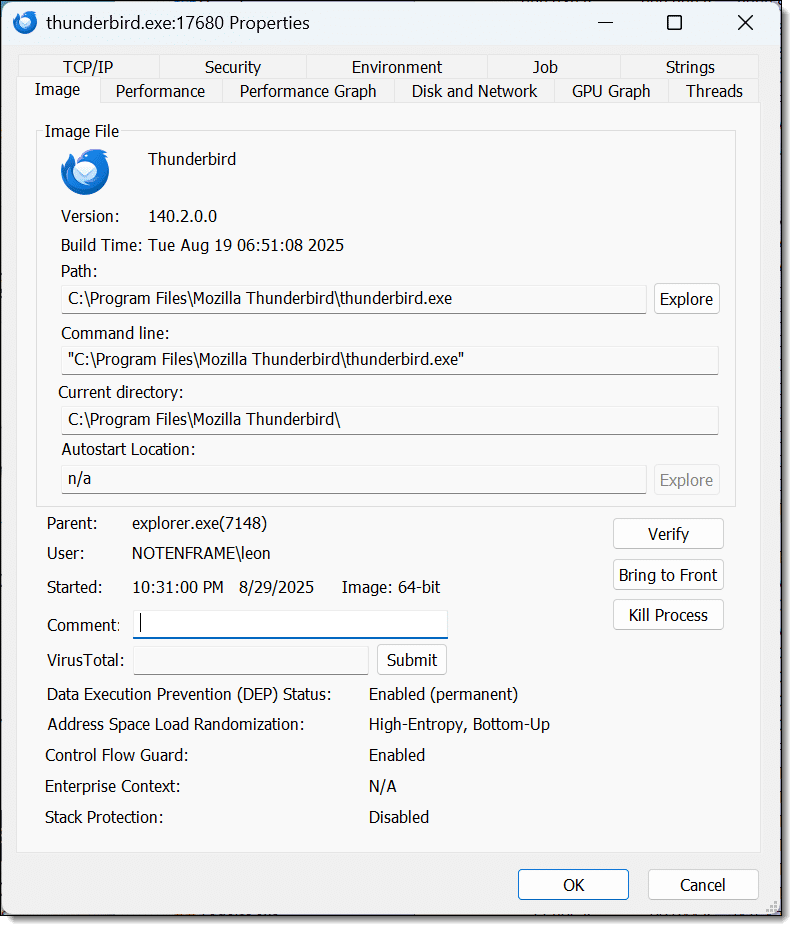
As you can see, the Properties view of a process — thunderbird.exe, in this case — shows a lot of additional information. Explore the various tabs on the dialog, and you’ll be able to see network usage, security attributes, the resource usage of the process, the command line used to start the process, and even anything that looks like a readable string within the process image or memory space.
System information
Finally, click anywhere on Process Explorer and type CTRL+I. This opens the “System Information” display.
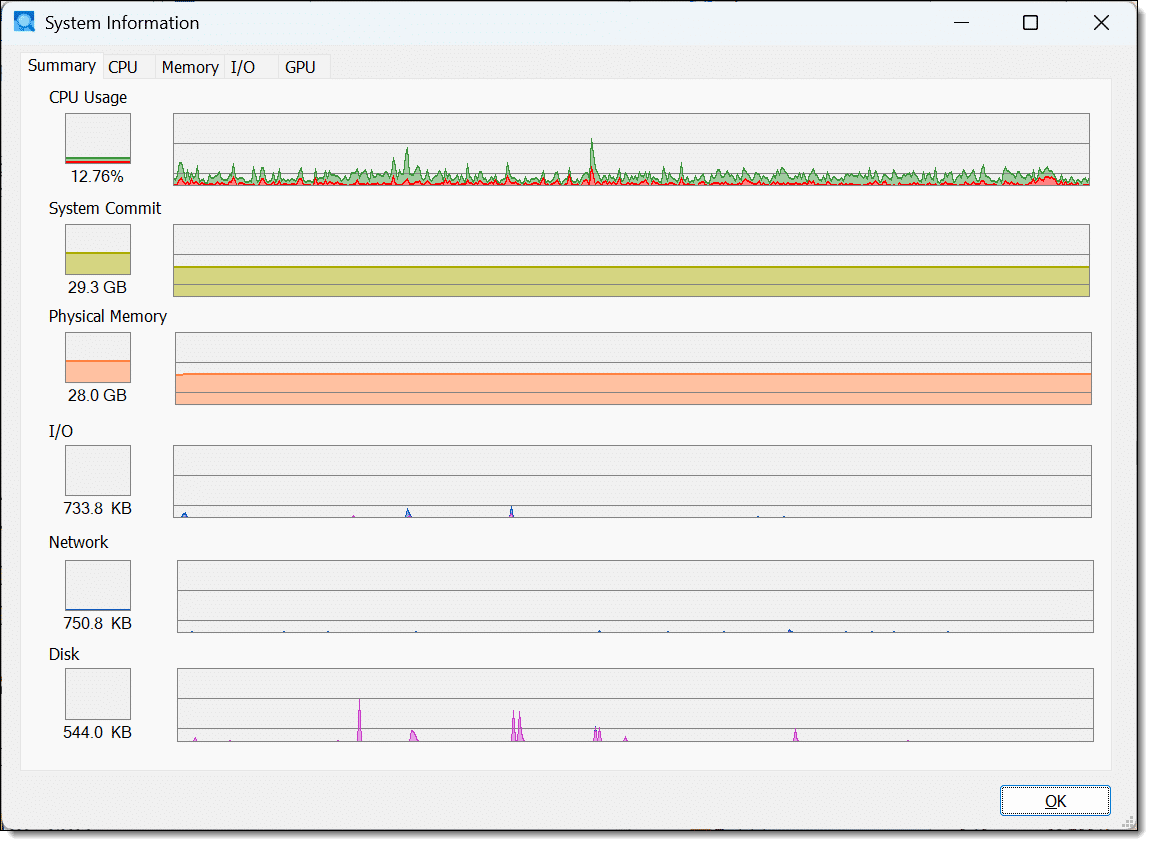
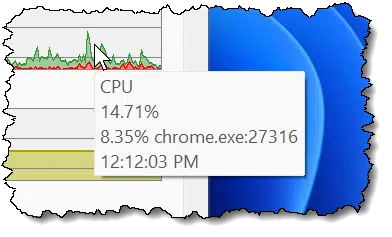
System Information presents an overview of what your system is doing and updates in real time. It’s great for watching trends over time as your computer goes about its work. Hover the mouse over any point in a graph, and you’ll see a tooltip with information about which process was at the top of the list then.
You can also click on the tabs shown at the top of the System Information dialog to get even more data about that specific topic.
Do this
I’ve only scratched the surface of what you can do with Process Explorer. Suffice it to say, it’s one of my go-to tools for diagnosing system issues. I have it running almost constantly.
Even if you don’t have a problem to investigate, Process Explorer is worth installing and exploring. There’s a wealth of information available, and you’ll get a good baseline of exactly what your system looks like when it’s not experiencing a problem.
Subscribe to Confident Computing! Less frustration and more confidence, solutions, answers, and tips in your inbox every week.


I am running Windows 10, and when I install the Sysinternals Suite, It adds like 40 new entries into my start menu instead of putting them into a folder, and I can’t locate where the shortcuts are stored in order to organize them. How do I fix this?
I’ve not been able to find a way to do so. For Windows 11 they install as a sub-menu.
What do the colors mean?
Click on Options -> Configure Colors and it’ll give you a list.
This was great reading and I imagine that it’s a really useful tool if one knew what they were looking for and the like. I was interested in this article because my usage and memory is being maxed out and I think that there are other things running in the background but not ones that are obvious, so I was looking for a way to see if there were any of the fifty Edge items listed in Task Manager were ones that I could close down and track to a service, say, and disable, or perhaps something else. Unfortunately, without knowing how to interpret the wealth of information that is in the new tool, I’m no closer to figuring that out! I will say that you’ve often had articles that have helped me immensely or were very informative, so thank you for all that you do to try to educate dunces like myself!