Introducing the Network Performance Display in Web Developer Tools
It really depends on which pages are causing slow-loading and why. There are, as you might expect, many possibilities.
I’m going to use this as an opportunity to introduce a diagnostic tool available in most modern browsers. While it’s generally packaged in something called “developer tools”, you don’t have to be a developer to use it or benefit from it.
Since you’re using Firefox, I’ll show you there.
Become a Patron of Ask Leo! and go ad-free!

Diagnosing Slow Pages
You can use web developer tools in Firefox and other browsers with network performance monitoring options that will display a file-by-file performance graph of a slow-loading page. Each file goes through several steps as part of the process, and looking for trends within a page, and across multiple page loads can point to problem areas.
Developer Tools
Click on the “hamburger icon” in the upper-right corner of the Firefox window to display the menu.
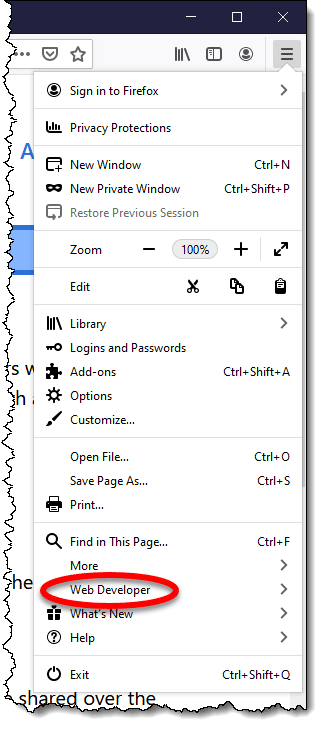
Click on Web Developer. This will display a sub-menu of options.
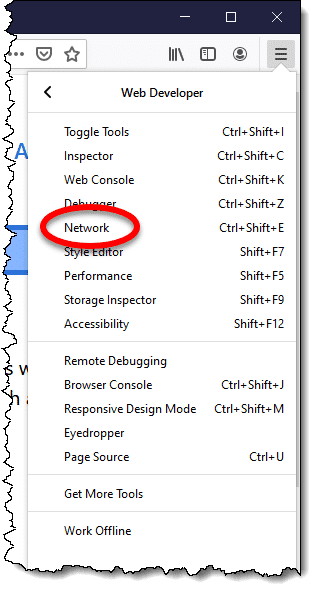
Click on Network. This will open an additional pane of information alongside or below your main webpage display.
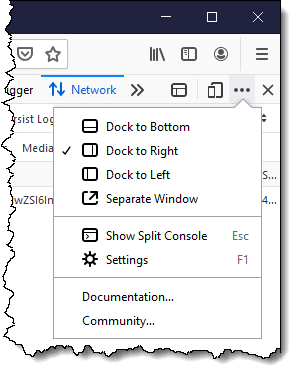
You can adjust the location of the pane to be below, to the right, to the left, or in a separate window entirely by clicking on the ellipsis in the upper-right corner of the pane.
You can also adjust the relative size of the pane by clicking and holding on the border separating it from the main window and dragging to a size you find useful. To provide as much screen real estate as possible, maximize Firefox.
Getting performance information about slow-loading pages
Click the refresh button on the webpage you’re viewing. The networking pane will be updated to reflect all the resources being requested by your web browser. This includes:
- The page itself.
- Every image on the page.
- Every style-sheet used by the page.
- Every JavaScript file used by the page.
- Additional font files used by the page.
- More.
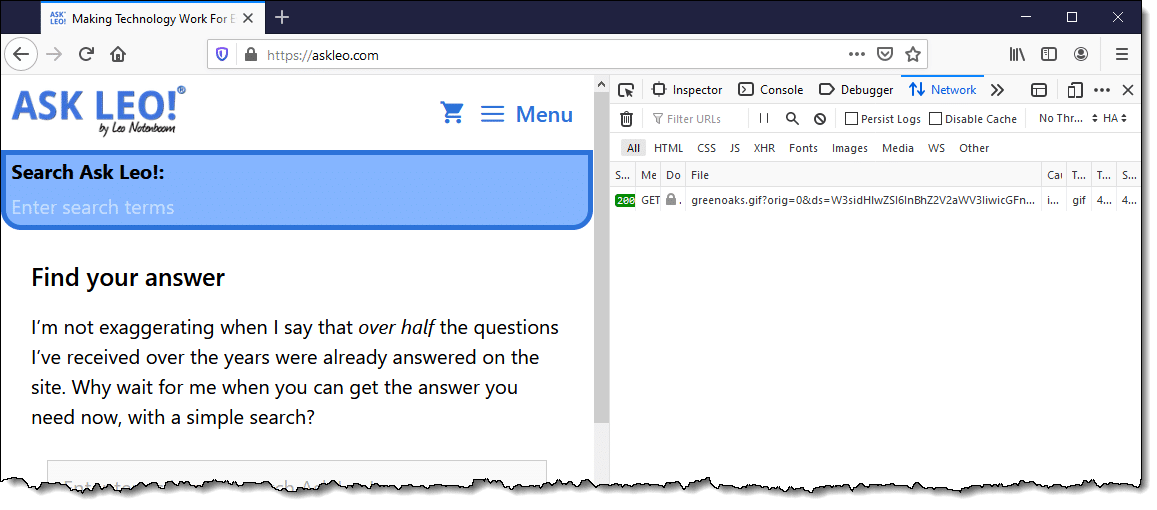
The result will display as a cascading “waterfall” of information in the networking pane. (You may need to resize the pane and/or the column containing the displayed waterfall. See the accompanying video for examples.)
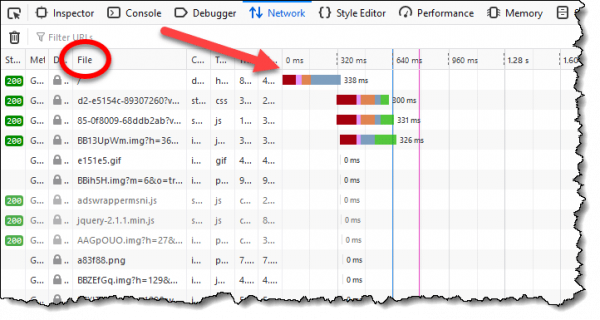
Each file is listed, along with a multi-colored bar representing various aspects of the amount of time it took to load that file.
Depending on the website design, there can be hundreds of files involved in displaying a single webpage.
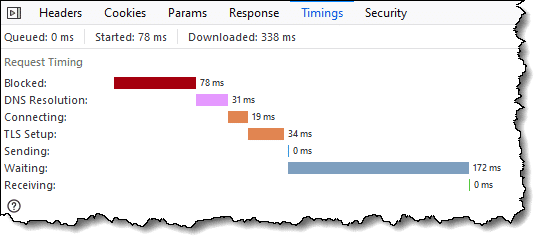
Click on a file to get a breakdown of the time spent fetching that single file.
We can use this information to diagnose some of the issues that lead to a slow webpage.
Aspect of speed
The items in the timing breakdown tell us various things.
Blocked. The browser tries to fetch several things from the server it’s connecting to at once, which minimizes the time it’s doing nothing while waiting for one or more of the items to complete. By default, Firefox attempts only six things at the same time. Being “blocked” is time waiting for one of those six items to complete. (I believe it may also include some internal overhead, as it is non-zero even on the very first request.)
If you’re seeing lots of files spending a disproportionate amount of time “blocked”, there’s not a lot you can do — this is a function of the webpage design and the speed of your connection to the server.
DNS resolution. Domain names, like “askleo.com”, are mapped to IP addresses, like 67.225.161.116, through the Domain Name System, or DNS. DNS servers take some time to respond to each request.
If you find DNS resolution appears disproportionately long, it might be time to consider using a different DNS provider.
Connecting. This is the amount of time it takes for your computer to establish a connection to the server hosting the webpage we’re attempting to view. This is generally a function of the speed of your internet connection, the path to that server, and the speed of that server itself. Unfortunately, there is little you can do to control this, other than get a faster connection or a better ISP.
TLS setup. When using an https connection, this is the amount of time spent by your computer and the remote server confirming that server’s identity and establishing the encrypted connection. Much like “connecting”, little of this is in your direct control.
Sending. This is the amount of time it takes for your computer to (finally) ask for the specific page you’re requesting. This is mostly a function of your internet speed.
Waiting. This is the amount of time spent waiting for the remote server to respond to your request. This is generally a function of the speed of that server, as well as the complexity involved in returning whatever you’ve asked for.
Receiving. This is the amount of time it takes to receive the response. Besides being mostly a function of your internet speed, larger responses (bigger pages, larger images, etc.) take more time.
Gather data, look for trends
When trying to diagnose slow-loading pages, we look for trends.
As I mentioned above, if DNS resolution takes a disproportionate amount of time across multiple files in your request, then it might be time to switch.
If you’re spending most of your time “waiting”, it could be that the service you’re accessing is simply slow.
If you look at the files being requested and notice a pattern — say all the files on one specific domain are slow, but the rest are fast — then perhaps just that specific service is slow. This often happens with servers that supply advertising, for example.
On occasion, the reason for a slowdown becomes quickly obvious. Unfortunately, that’s not always the case, and we need to rely on looking for these types of patterns as the webpage is fetched.
And finally, remember that big things take time. Two of the most common causes for things being slow are:
- We’ve asked the website to perform a lot of work before returning a response — something like completing a sale or querying a database.
- We’ve asked the website to return something large, such as one or more high-quality pictures.
In both cases, the solution remains the same: be patient.
If you found this article helpful (and hopefully not too slow-loading!) you’ll love Confident Computing! My weekly email newsletter is full of articles that help you solve problems, stay safe, and increase your confidence with technology.
Subscribe now, and I’ll see you there soon,

Related Video


Podcast audio

Footnotes & References
Network request details from the Mozilla Developer Network

Thank you, Leo, slow web pages are an affliction from which we all seem to suffer, and I commend you for writing the first article I have ever seen to explain the diagnostic tools available. My browser, MyPal, is an off-shoot of Pale Moon, a stripped-down fork of Firefox, but I still easily found the Network tool you describe.
You did say that “depending on the website design, there can be hundreds of files involved in displaying a single webpage”. This seems to me to be the essence of the problem, and it is one of the banes of modern life. Traditional web-pages, like yours, I’m glad to say, flash up quickly even on my old machine, but others can be seen in the status bar to be communicating with a plethora of irrelevant sites, Facebook and Twitter generally amongst them, before they finally load. Fortunately my ad-blocker suppresses a lot of this questionable activity, but it is still a huge nuisance which renders some sites almost unuseable, even though I now have fast fibre broadband. I wish web designers could be persuaded to keep sites more simple.